TAMMS 3.38.0 - Dashboard Update
This version introduces an updated dashboard for clearer maintenance analytics and real-time overview.
TAMMS 3.38.0 - Dashboard Update
Over the past period, we have placed strong emphasis on precise data entry and secure data storage in the TAMMS system. We have now reached an important milestone: we have created the most informative way to display collected data, raising the transparency of maintenance processes to a new level.
Real-Time Overview
Through the updated dashboard, the most important maintenance indicators become available with a single click. Below are a few key indicators among many others that help monitor the efficiency of maintenance activities in real time:
Our Design Goals
- Comprehensive graphical presentation: Visually easy-to-understand charts
- Maintenance-specific KPIs: The most important performance indicators in one place
- Interactive data visualization: Click any value shown in a chart or statistical indicator to immediately view the related detailed data.
Interactive Data Visualization
One of the dashboard's most important new features is interactivity: by clicking any value displayed in a chart or statistical indicator, the related detailed data can be viewed immediately. Whether it concerns technical locations, warehouse items, or employees involved in maintenance, every data point is available with a single click and can be examined in detail.
Flexible Filtering Options
The dashboard does not only show the current status; it also offers highly flexible filtering options:
- By time interval: Daily, weekly, monthly, or custom time periods
- Personalized views: Track the performance of selected employees or groups
- By technical location: Detailed analysis of specific areas or equipment
- Combined filters: Different filtering criteria can be combined freely
Dashboard filter module:

One of the core pillars of the dashboard-based system is its complex and easy-to-use filtering capability. It helps users monitor the desired values easily. The filter is fast and clear. It provides immediate results. Machine groups, plants, production units, and cost centers can be selected with ease.
Our advanced filtering system allows you to find the information you need within seconds, saving valuable time in daily work. Thanks to the intuitive user interface, no lengthy training is required: it is ready to use immediately and delivers results quickly.
Currently, the following filtering options are available:
- technical location
- user
- entry type
- discipline
- period
Entry status pie chart:
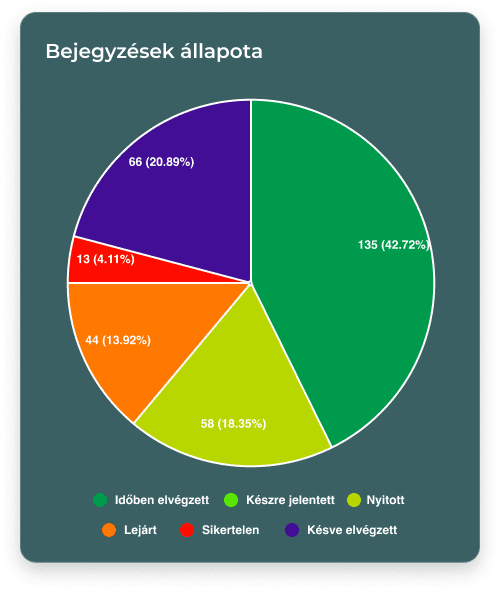
The status of entries is displayed as a pie chart. This view shows the distribution of entries by status. These categories can be defined in the TAMMS system.
With our innovative visualization solution, the entire maintenance process can be understood at a glance. The pie chart does not only display data; it provides real-time insight into the current status of maintenance tasks, supporting fast and efficient decision-making.
Our goal is for office teams to see not only data, but also the utilization status of their team.
Top technical locations bar chart:
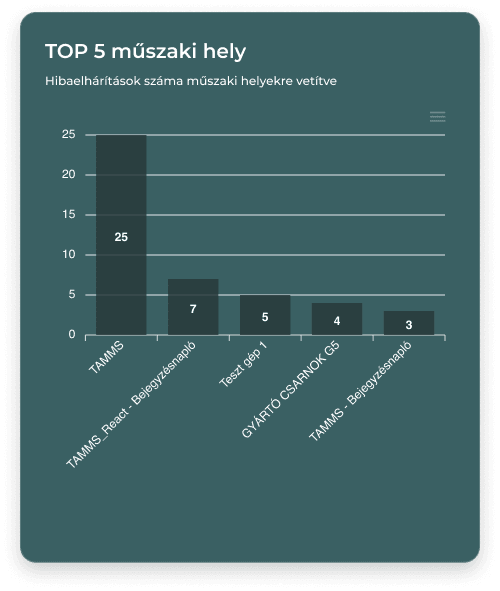
The most important technical locations are displayed by the system based on the most recent entries. This chart highlights the technical locations with the highest number of troubleshooting entries. In other words, it can serve as a ranking of the most problematic machines, which are often among the most costly parts of production.
Our intelligent analytics system automatically identifies critical points, enabling proactive maintenance and cost optimization. The visual presentation supports efficient resource allocation and fine-tuning of the maintenance strategy.
Warehouse item movement:
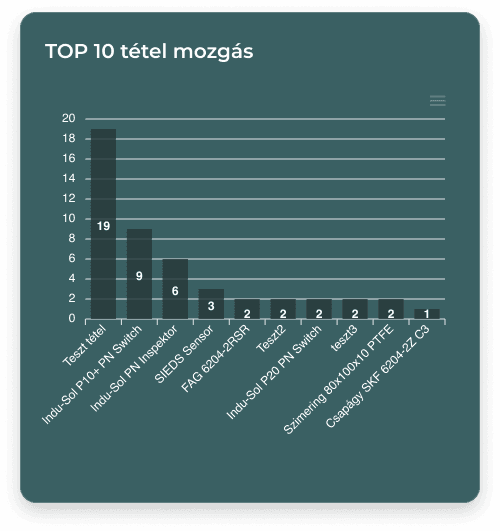
The item movement chart shows a ranking of the items that have been moved most frequently.
Our advanced warehouse management module tracks inventory movements in real time, helping maintain optimal stock levels and efficient resource management. With automated reporting, you always have up-to-date information about warehouse processes.
Acknowledgements
We would like to thank all our partners who contributed to the continuous development of the TAMMS system with their valuable feedback and suggestions. Your professional experience and constructive insights were essential in shaping the Dashboard module. Special thanks go to our users who actively participated during the testing period and supported our work. With your support, we continue working to ensure that TAMMS provides the best possible solution for managing maintenance processes. Thanks Bence, Zoli, and Balazs! ;)